Franchising, retail, business

28/01/2016
Stefano F. Fugazzi (ABC Economics) – A newly published research by the European Union “pictures” the distribution of poverty, inequality and social exclusion across the EU Member States.
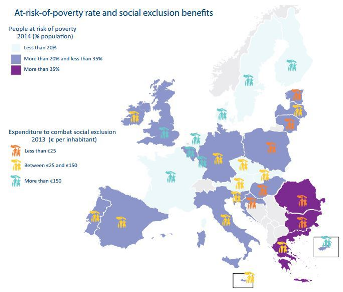
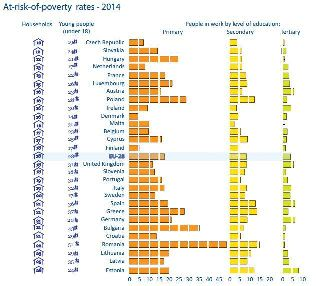
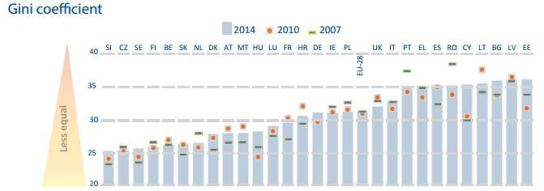
Based on 2014 data, their infographic analysis shows which country is more at risk, the distribution of disposable income and how much EU countries spend on specific measures to combat poverty and inequality.
*The at-risk-of-poverty rate refers to persons with an income below 60% of the national median.
** Expenditure to combat social exclusion shows benefits in cash or in kind (other than healthcare), for 2013, except for Ireland, Greece and Poland where data for 2012 are shown.

*** The Gini coefficient is the most commonly used measure of inequality. It is based on the ‘equivalised’ (i.e. weighted) disposable income of each individual country; 0 indicates total equality (everyone would dispose of the same income) and 100 complete inequality, where a single person would have all income